Table of Contents
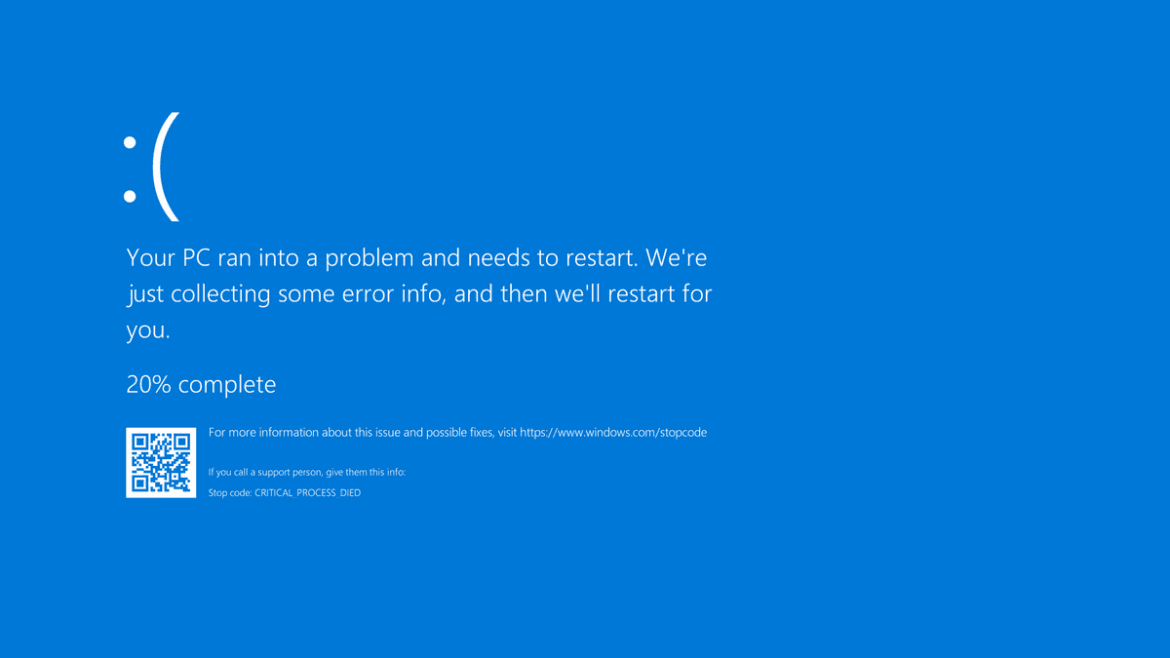
A blue screen error occurs on a Windows system after the system crashes. When Windows has a catastrophic error, it crashes. The crash usually brings a blue screen (affectionately known as Blue Screen of Death or BSOD) which displays a whole load of information detailing the crash. Within the information, there will be the why, where, and how the crash happened. It pops up unexpectedly, which will force a user to restart the system in the middle of their work. The error is an unpremeditated sign and is frustrating when the user finds it hard to debug the problem causing it.
Many handy tools help a user debug these problems. One of the tools is the Windows Debugger tool (Windbg), which allows the user to read the error report for troubleshooting and solve the blue screen errors.
Causes of Blue Screen Of Death (BSOD) errors
The blue screen errors are displayed when your operating system reaches a threshold limit where the system is vulnerable and no longer functions correctly. Other causes of blue screen errors include faulty hardware, faulty software, out-of-date/ poorly constructed drivers, overheating, overclocking, etcetera. Within these five different causes lies numerous specific errors. This is where the blue screen of death error code steps in. The blue screen of death error code gives you a particular error to troubleshoot and focus your efforts rather than take a guess at what went wrong and why.
Fixing a blue screen error depends on the type of error. Sometimes, an internet search is enough to reveal what is wrong with your system, while other times, you will need the help of WinDbg to help you debug the system.
How to fix BSOD errors
WinDbg is a powerful tool you can use to figure out the root cause of your blue screen error.
Head over to the Windows 10 SDK download page. The windows 10 SDK contains numerous tools, including the Windows Performance toolkit, debugging tool for Windows, the .NET framework software development kit, and other development tools. Follow the steps below:
- On the Windows10 SDK page, hit the Download the Installer button. Then, run the installer once downloaded.
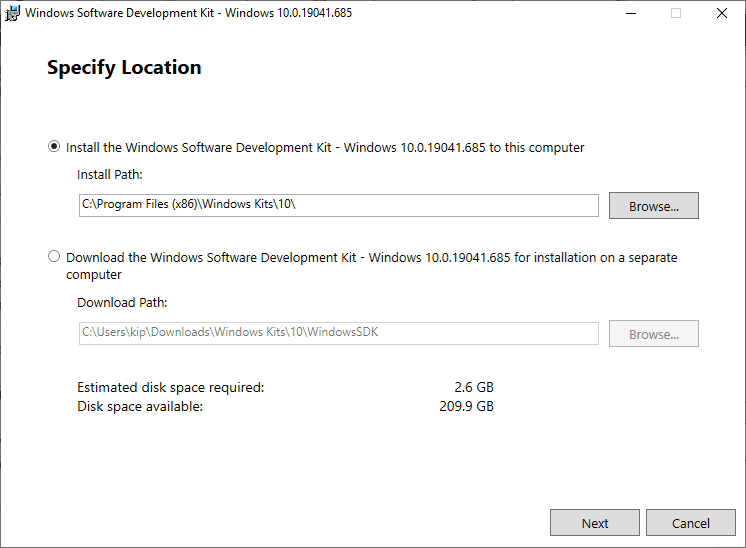
- Launch the Installer, select the first option to Install the Windows Software Development Kit to your computer. The default installation path is good.

installing windisk
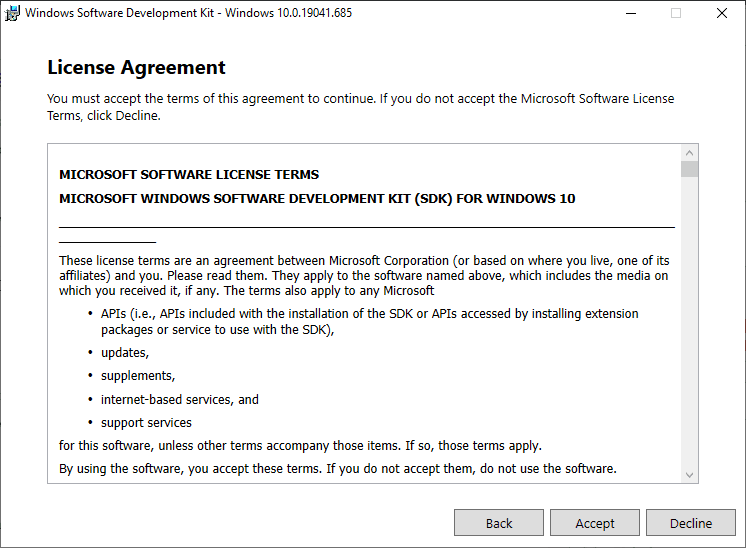
- Choose Next to continue and accept the license.

windows software development kit license agreement
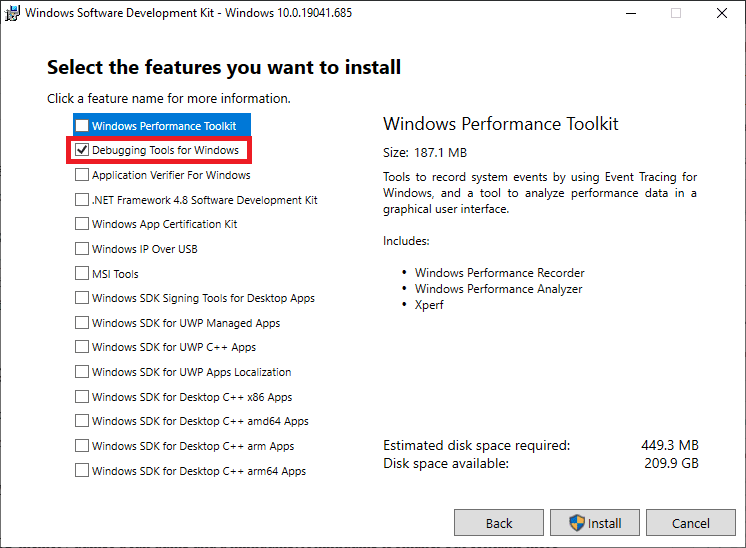
Next, uncheck all boxes bar to the Debugging Tools for Windows, then click “Install.”

windows software development kit uncheck all debug tools
Opening and configuring WinDbg
On the Start menu, head to Windows kits > WinDbg.
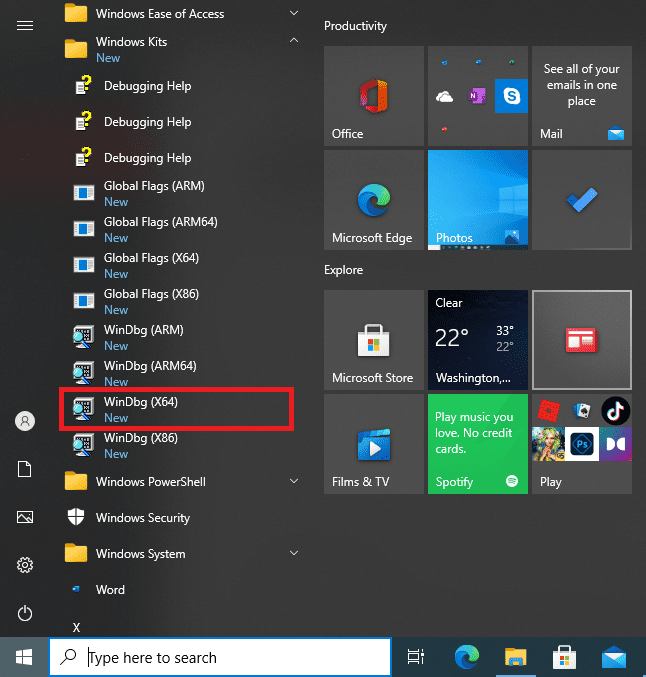
launch windbg
Note: Use the debugger suitable with your system architecture, i.e., if your system is 32 bit or 64 bit, choose WinDbg X32 or WinDbg X64, respectively. For my case, I choose the 64-bit version since it suits my system’s architecture.
Now you will need to find your BSOD memory dump, which contains the information regarding the crash, such as the cause and location.
There are two types of BSOD memory dumps a full dump and a minidump. A minidump is smaller but contains more information than a full dump.
If you are not experiencing a blue screen fatal system error, then that means that there will be no memory dump to capture, and you will get an empty screen like the one shown in this image.
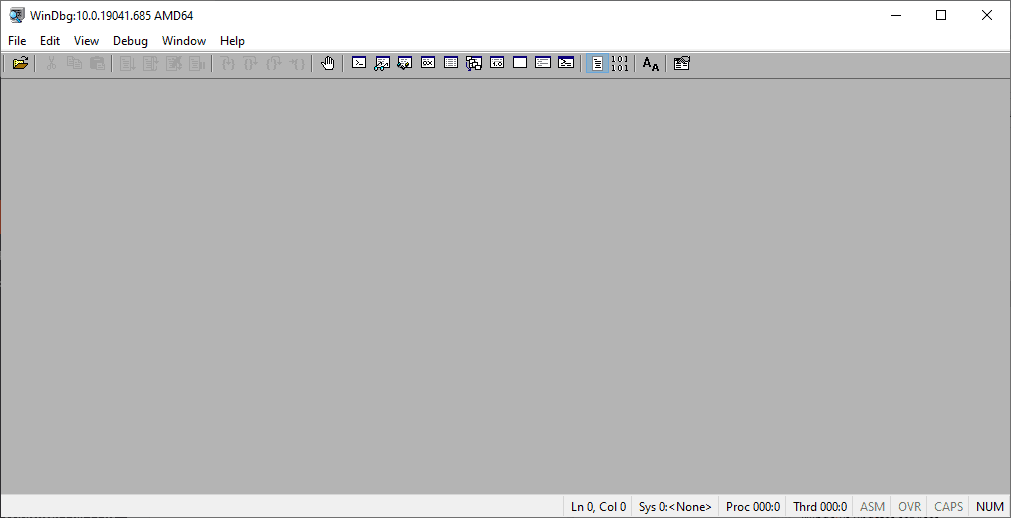
windbg
You will have to create a memory dump. To do this, follow these steps:
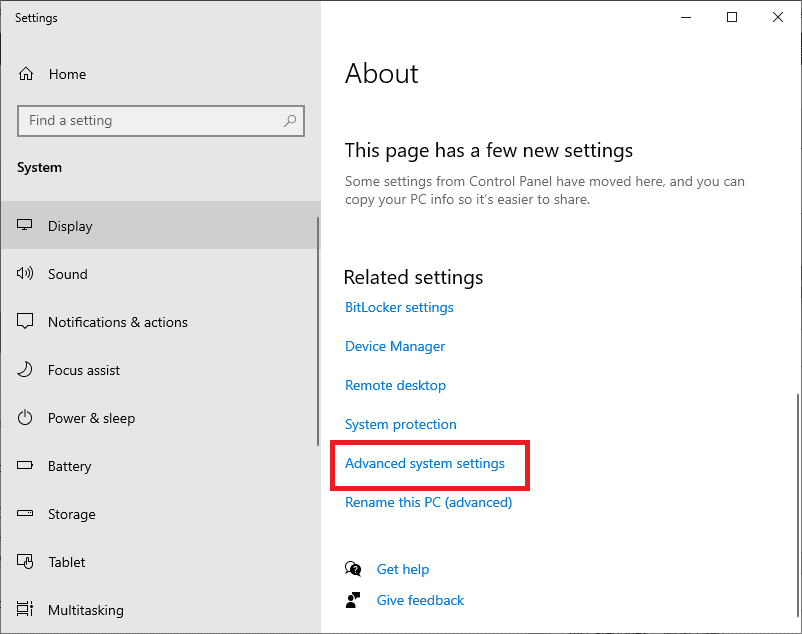
- Press the WinKey + Pause to open the system properties windows. Alternatively, you can search the system properties from the start menu.

system properties window
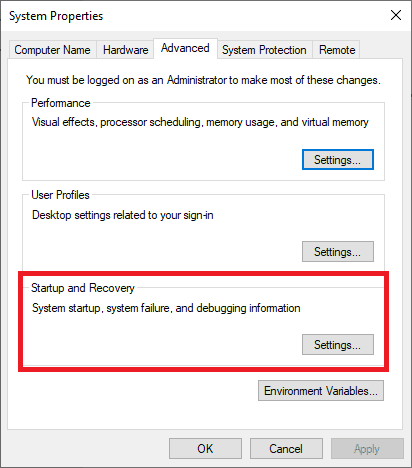
- Click Advanced, and under Start-Up and Recovery, select Settings

startup and recovery settings
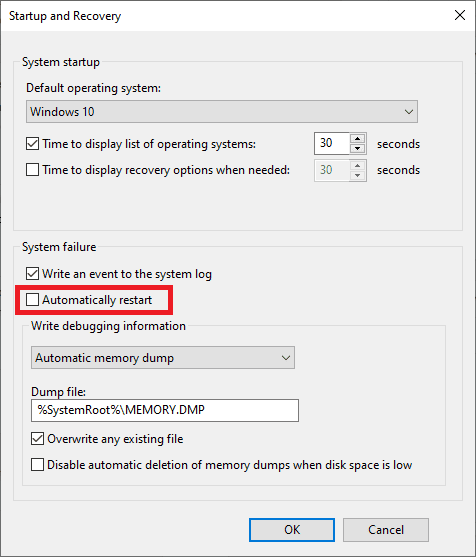
- Uncheck Automatically Restart

uncheck automatically restart
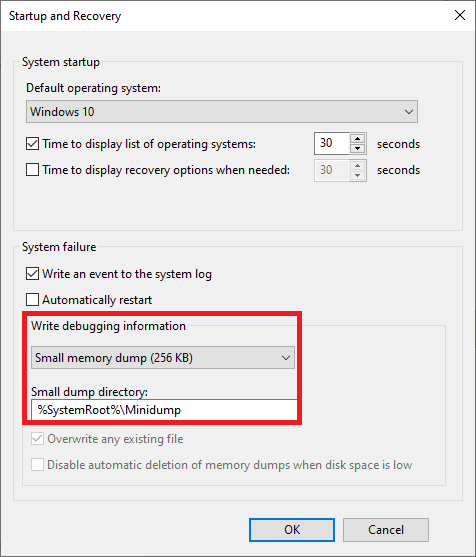
- Click on the drop-down arrow under Write Debugging Information
- Select Small memory dump (64 KB) and make sure the output is %SystemRoot%Minidump

select small memory dump
- Restart the PC normally. This will create a system error/blue screen and then create the minidump.
You will find the minidump logs in your root directory:
C:/Windows/minidump
In the folder, you will find the actual minidump logs. Alternatively, the full dump is located at:
C:/Windows/memory.dmp
First, you will need to set a symbols source. Symbols are essentially identifiers for programming languages that relate to specific information. They make it easier to analyze the information found in a log or code.
- Go to File > Symbol file path, then copy and paste the following:
SRV*C:/websymbols*http://msdl.microsoft.com/download/symbols
after pasting, press “OK.”
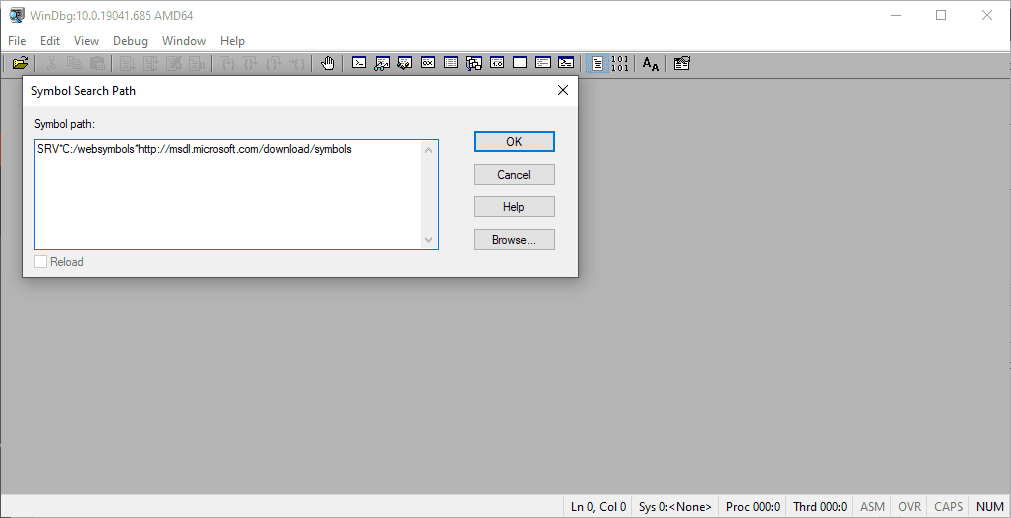
symbol file path
Analyzing your crash dump in WinDbg
Drag and drop your dump file into Windbg. You can also press Ctrl + D to open the file browser then locate your dump file.
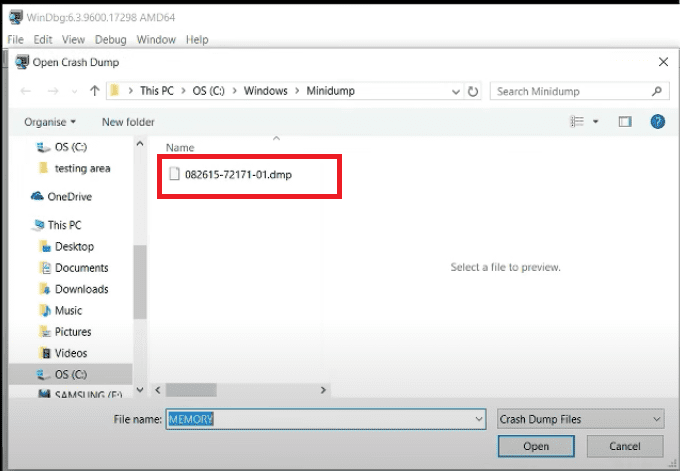
ctrl d to locate minidump
When the file loads, you will meet the initial analysis screen. You will look for the “Bug Check” and the “Probably caused by” fields from the screen.
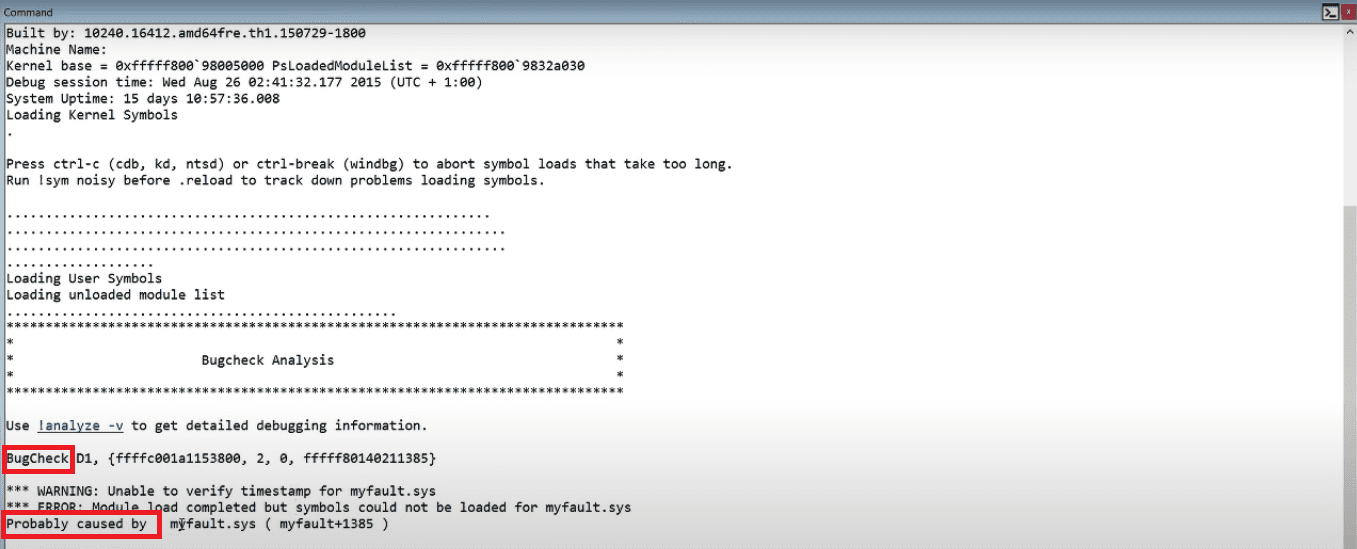
bugcheck and problem caused by
You can take the analysis one step further using WinDbg commands such as the:
<kd> !analyze -v
command, which may appear on the screen highlighted.

kd analyze command
There is a command link under the Bug check Analysis header. This link sometimes disappears. If there is no link, enter the command in the field at the bottom of the WinDbg window.
The command performs a colossal amount of automated analysis. WinDbg displays the results under a new BugCheck Analysis header. The amount of information WinDbg will give maybe a little overwhelming, but you will only be looking for a few critical bits of information to bulk out the assessment of your BSOD.
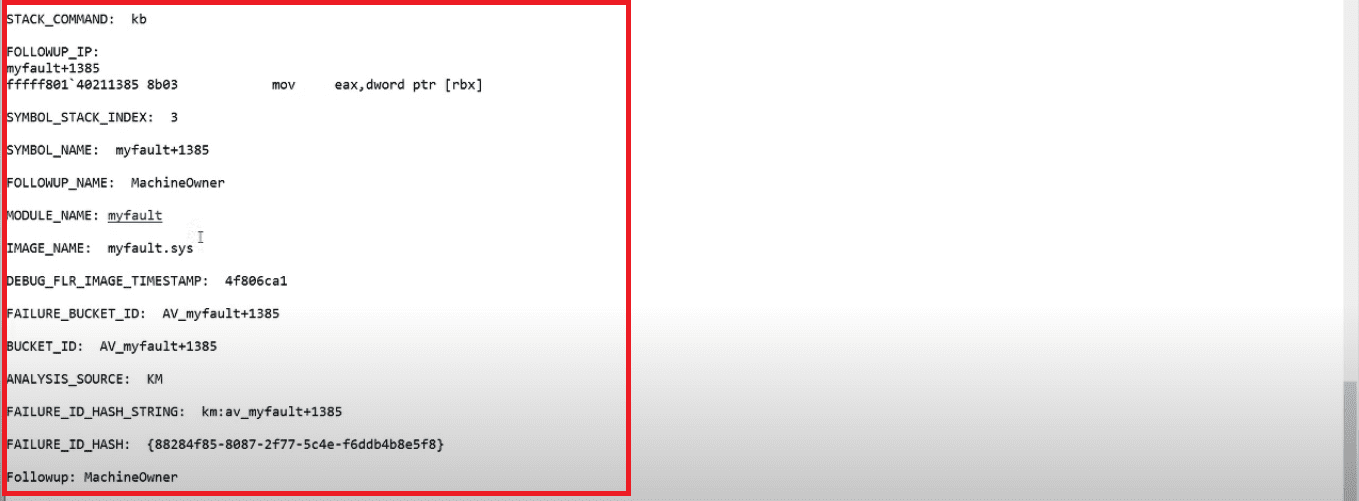
new bug check results
The parameters that are directly under the new BugCheck Analysis header provide another set of helpful information. Additionally, the Arguments (informative parameters) expand on the information. If you have no idea about the displayed errors, then a simple internet search on these errors would be the best approach to solve them. Searching for a combination of the initial error code and the additional argument information will return results of other users suffering the same issues since the system error you have is not new and mysterious. The same BSOD will have affected someone else.
Tips!
On the bottom of the screen, you will see the following statement:
<kd>
To the right is where you can type the
!analyze -v
or
.lastevent
commands, then press the Enter key.
This will show you the error record and stack trace of the function where the error occurred. You can also use the:
.exr, .cxr, .ecxr
commands to display the error and context records.
When working with drivers, you can use:
kd> lm tn
To get extra information.
Conclusion
This article has briefly discussed how to fix the Blue Screen of Death (BSOD), configure the WinDbg, and create memory dumps. We hope that this article was helpful and helped you resolve your blue screen errors. Feel free to visit the comment section if you have queries, and we will reach out to you.
3 comments
Give me the solution for the below issue.
“Windows can not be updated due to some reason, restoring changes”
It came after installing restarting after the update.
Stay put, an article on that topic is on its way
You should have someone proof read your articles before posting
“Analyzing your crush .. ” should be “Analyzing your crash …”